OBIEE 12c has not only changed in terms of architecture,but also in the way we do reporting. Everything has become so simple and easy to understand (of course if you have know earlier versions well). The display of images next to data to instantly understand the trend is one of the ways. Earlier version the same can be done but we have to do a bit of ground work for that, 12c gets it done a lot easier.
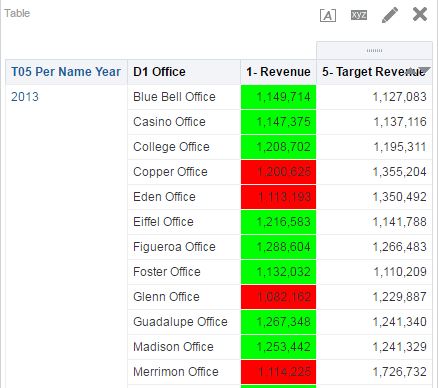
Let me consider a small report as shown in image below, where we display the Year, Office , Revenue and Target Revenue. Which is quite simple.
Now we have a lot more ways to highlight the data to show if the Revenue as met the Target.

Write a conditional format where you check if Revenue is higher than Target Revenue then Display in Green and if not in Red as shown below.
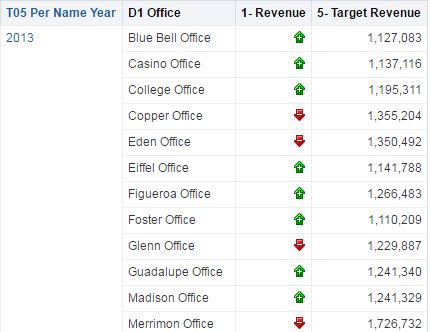
This looks good where as not presentable, you cant show red and green in presentations, it will be far better if we can use some arrows with Green and directed upwards for green and Red with looking down. This can be achieved using the Image option given in Column Format.
I will write a small conditional Format on the column Revenue to fullfill this.

Similarly for downward trend select a Red arrow going down. The report will look like below.

There are three options on the position of image, Left, Right and Image Only.
Left - to display the image on the Left on Data Value
Right - to display the Image on the Right of Data Value , which is also the system default
Image Only - to display the image alone and suppress the Data Value from the Report, Like Below.
Hope this helped !
No comments:
Post a Comment